Modern analytics
Incredibly powerful, super easy to use. Included with all our stream and podcast plans.
Pricing & signupOur modern analytics delivers unmatched insights into stream and podcast listenership.
Rich metrics
Track every aspect of audio consumption.
Deep insights
Dive into listener behaviour, technology, location and more.
Ad-hoc filters
Drill down into audience segments with multiple ad-hoc filters on data.
Geospatial data
Understand and visualise where listeners are from.
Application support
Extensive recognition of audio applications and devices.
Truly responsive
Works great from mobile to desktop, accessible everywhere.
Print perfect
Create beautiful PDF and paper reports right out of the box.
Export
Export any aspect of data to CSV, for easy custom reporting.
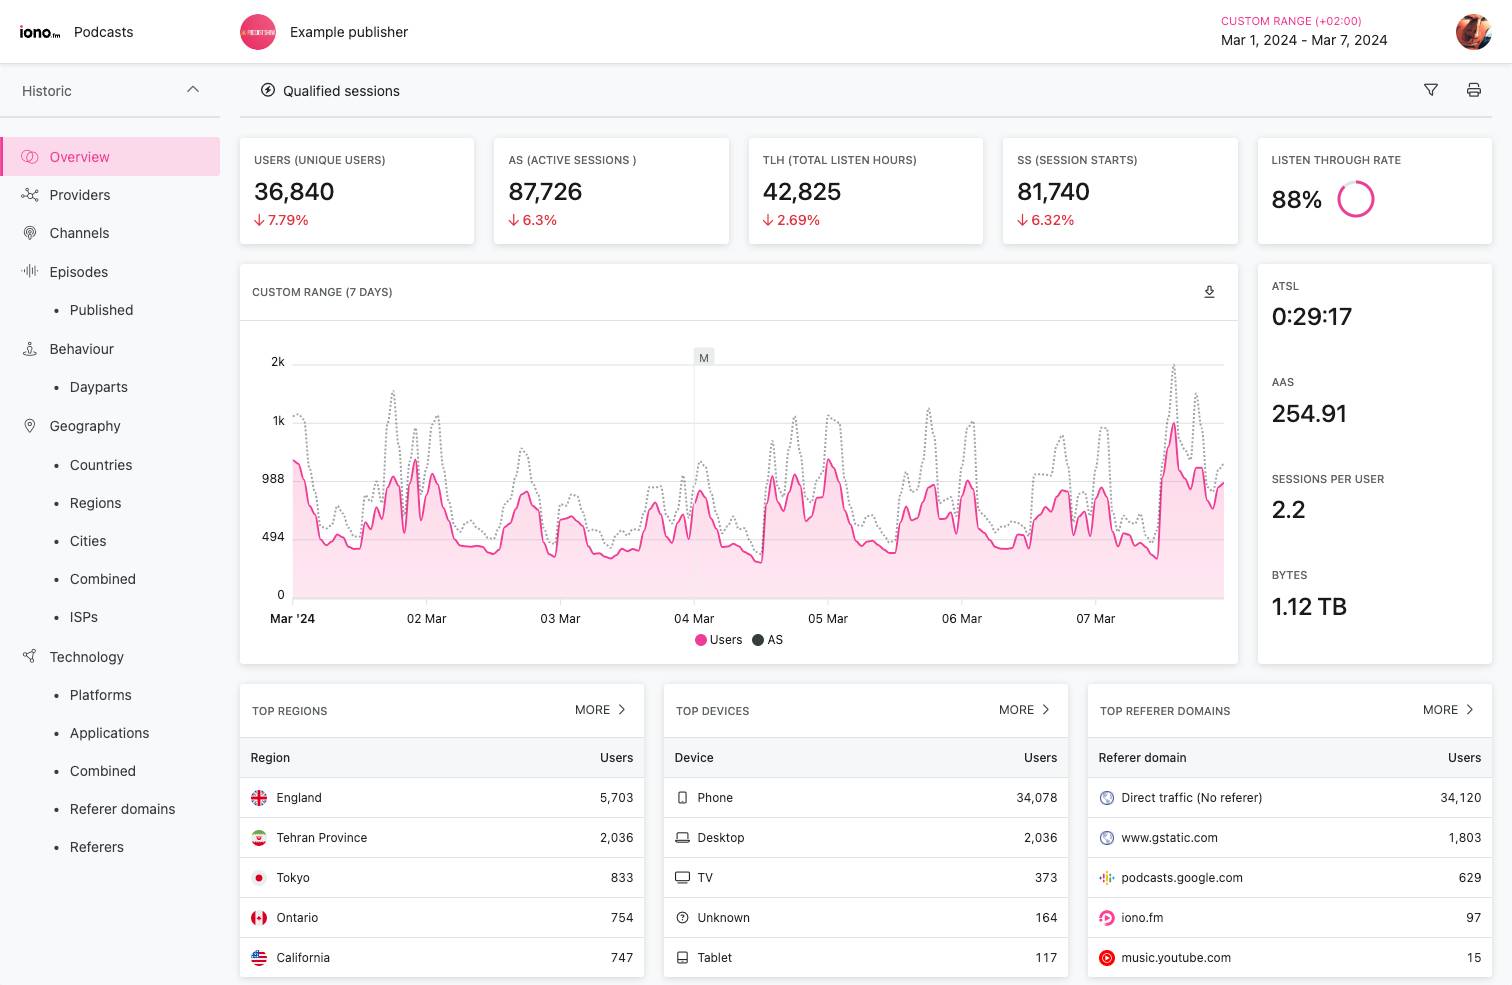
Rich metrics
See all the standards based audio metrics.
- Unique users
- Active sessions
- Session starts
- Total listen hours
- Average time spent listening
- Average active sessions
- Bytes sent
- Peak listeners (stream)
- Listen-through-rate (podcast)
Stunning user interface
Easy to use, with advanced features just a click away.
Intuitive data exploration with a clear and concise layout.
Advanced filtering and sorting features delivers reporting super-powers.


Slice .. and dice
Choose from a wide range of dimensions and apply multiple ad-hoc filters.
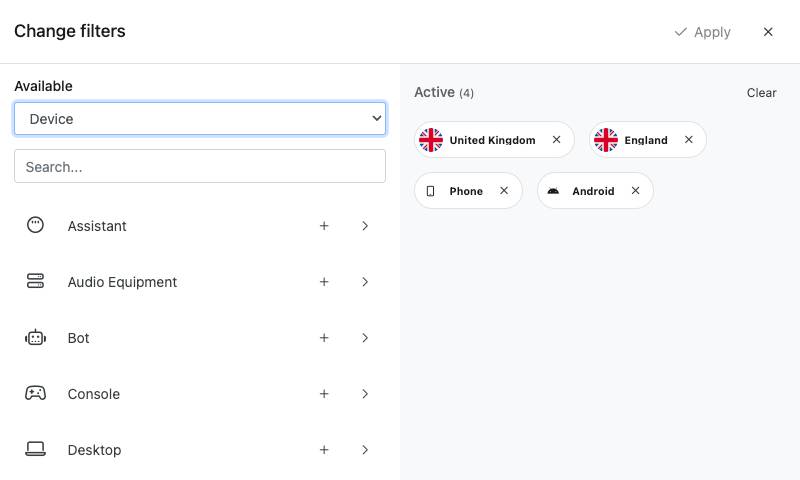
- Focus on a stream, podcast show or even specific podcast episode.
- Drill down into any specific audience segment like never before:
- Daypart, location, country, region, city, ISP,
- Technology, device, platform, application, referrer,
- And more..
Understand when, where and how audiences are listening.
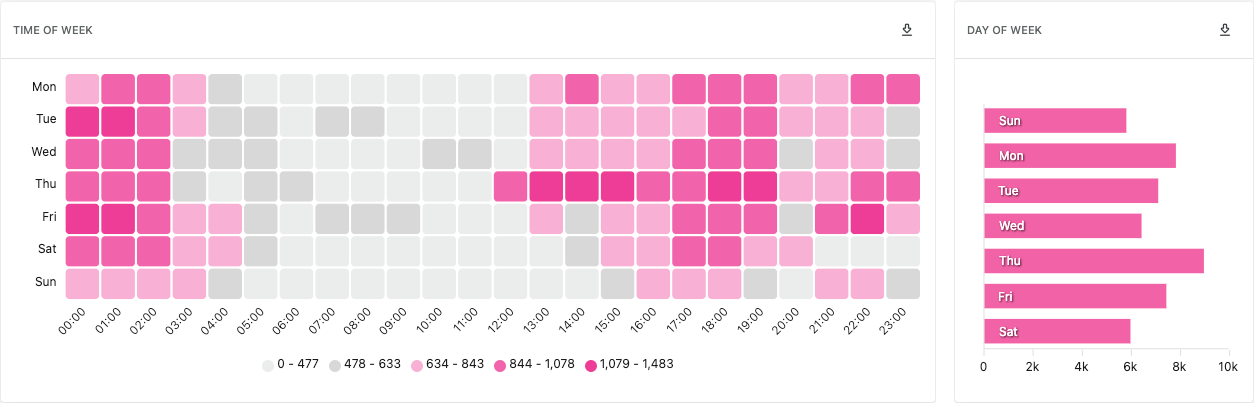
Behaviour
When are listeners tuning in, and how long do they listen.
- Daytime heatmap
- Day of week
- Hour of day
- Listen through rate (podcast)
- Drop-off rate (stream)
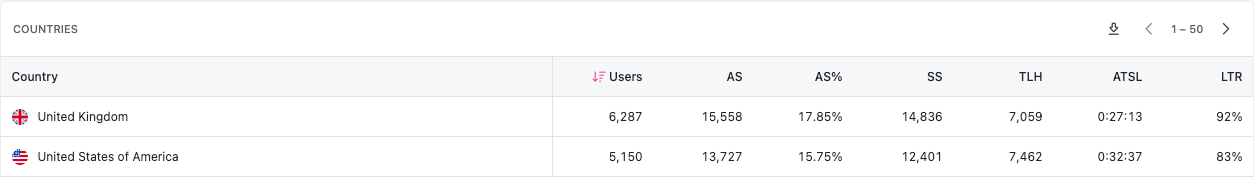
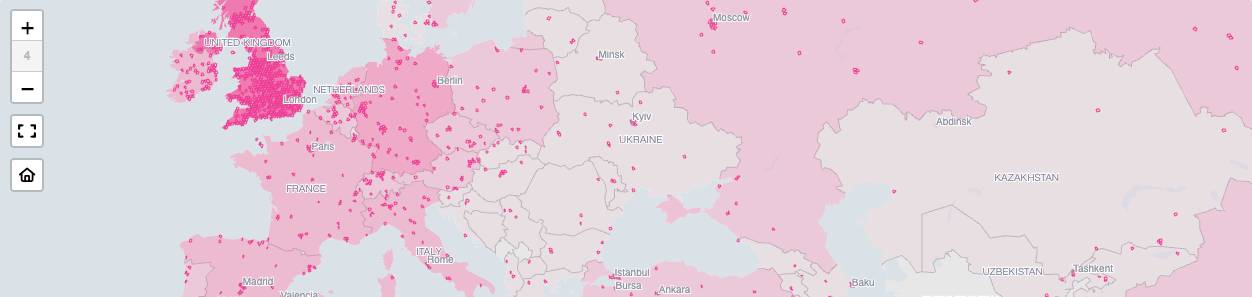
Geography
Where do listeners come from?
Browse geographic data with both country and region chloropleth maps, in addition to detailed location cells.
Detailed breakdowns by country, region and city, powered by a commercial IP geolocation database.
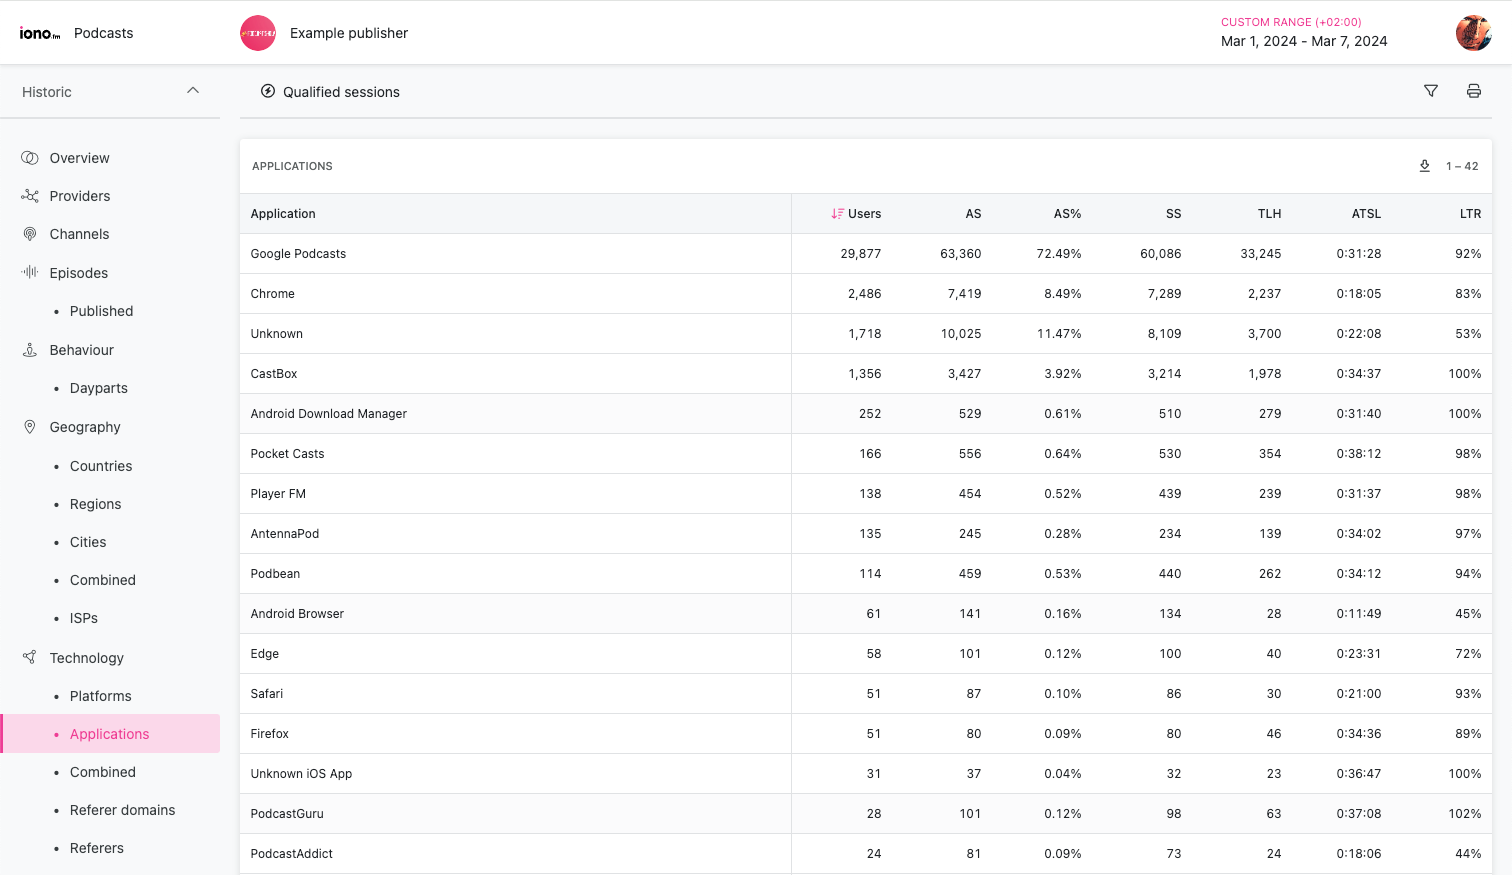
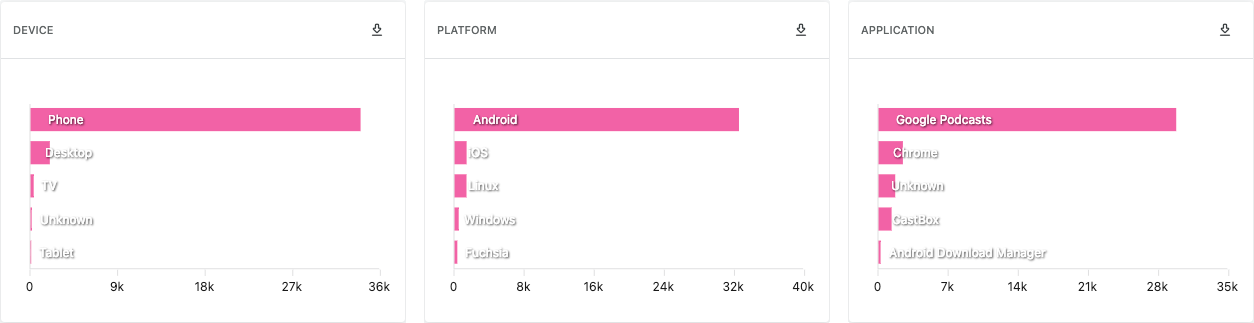
Technology
What devices & applications are listeners using?
We combine several 3rd-party databases with hundreds of custom rules, all specifically optimised to recognise the vast array of applications and devices in the podcast and radio streaming eco-system.
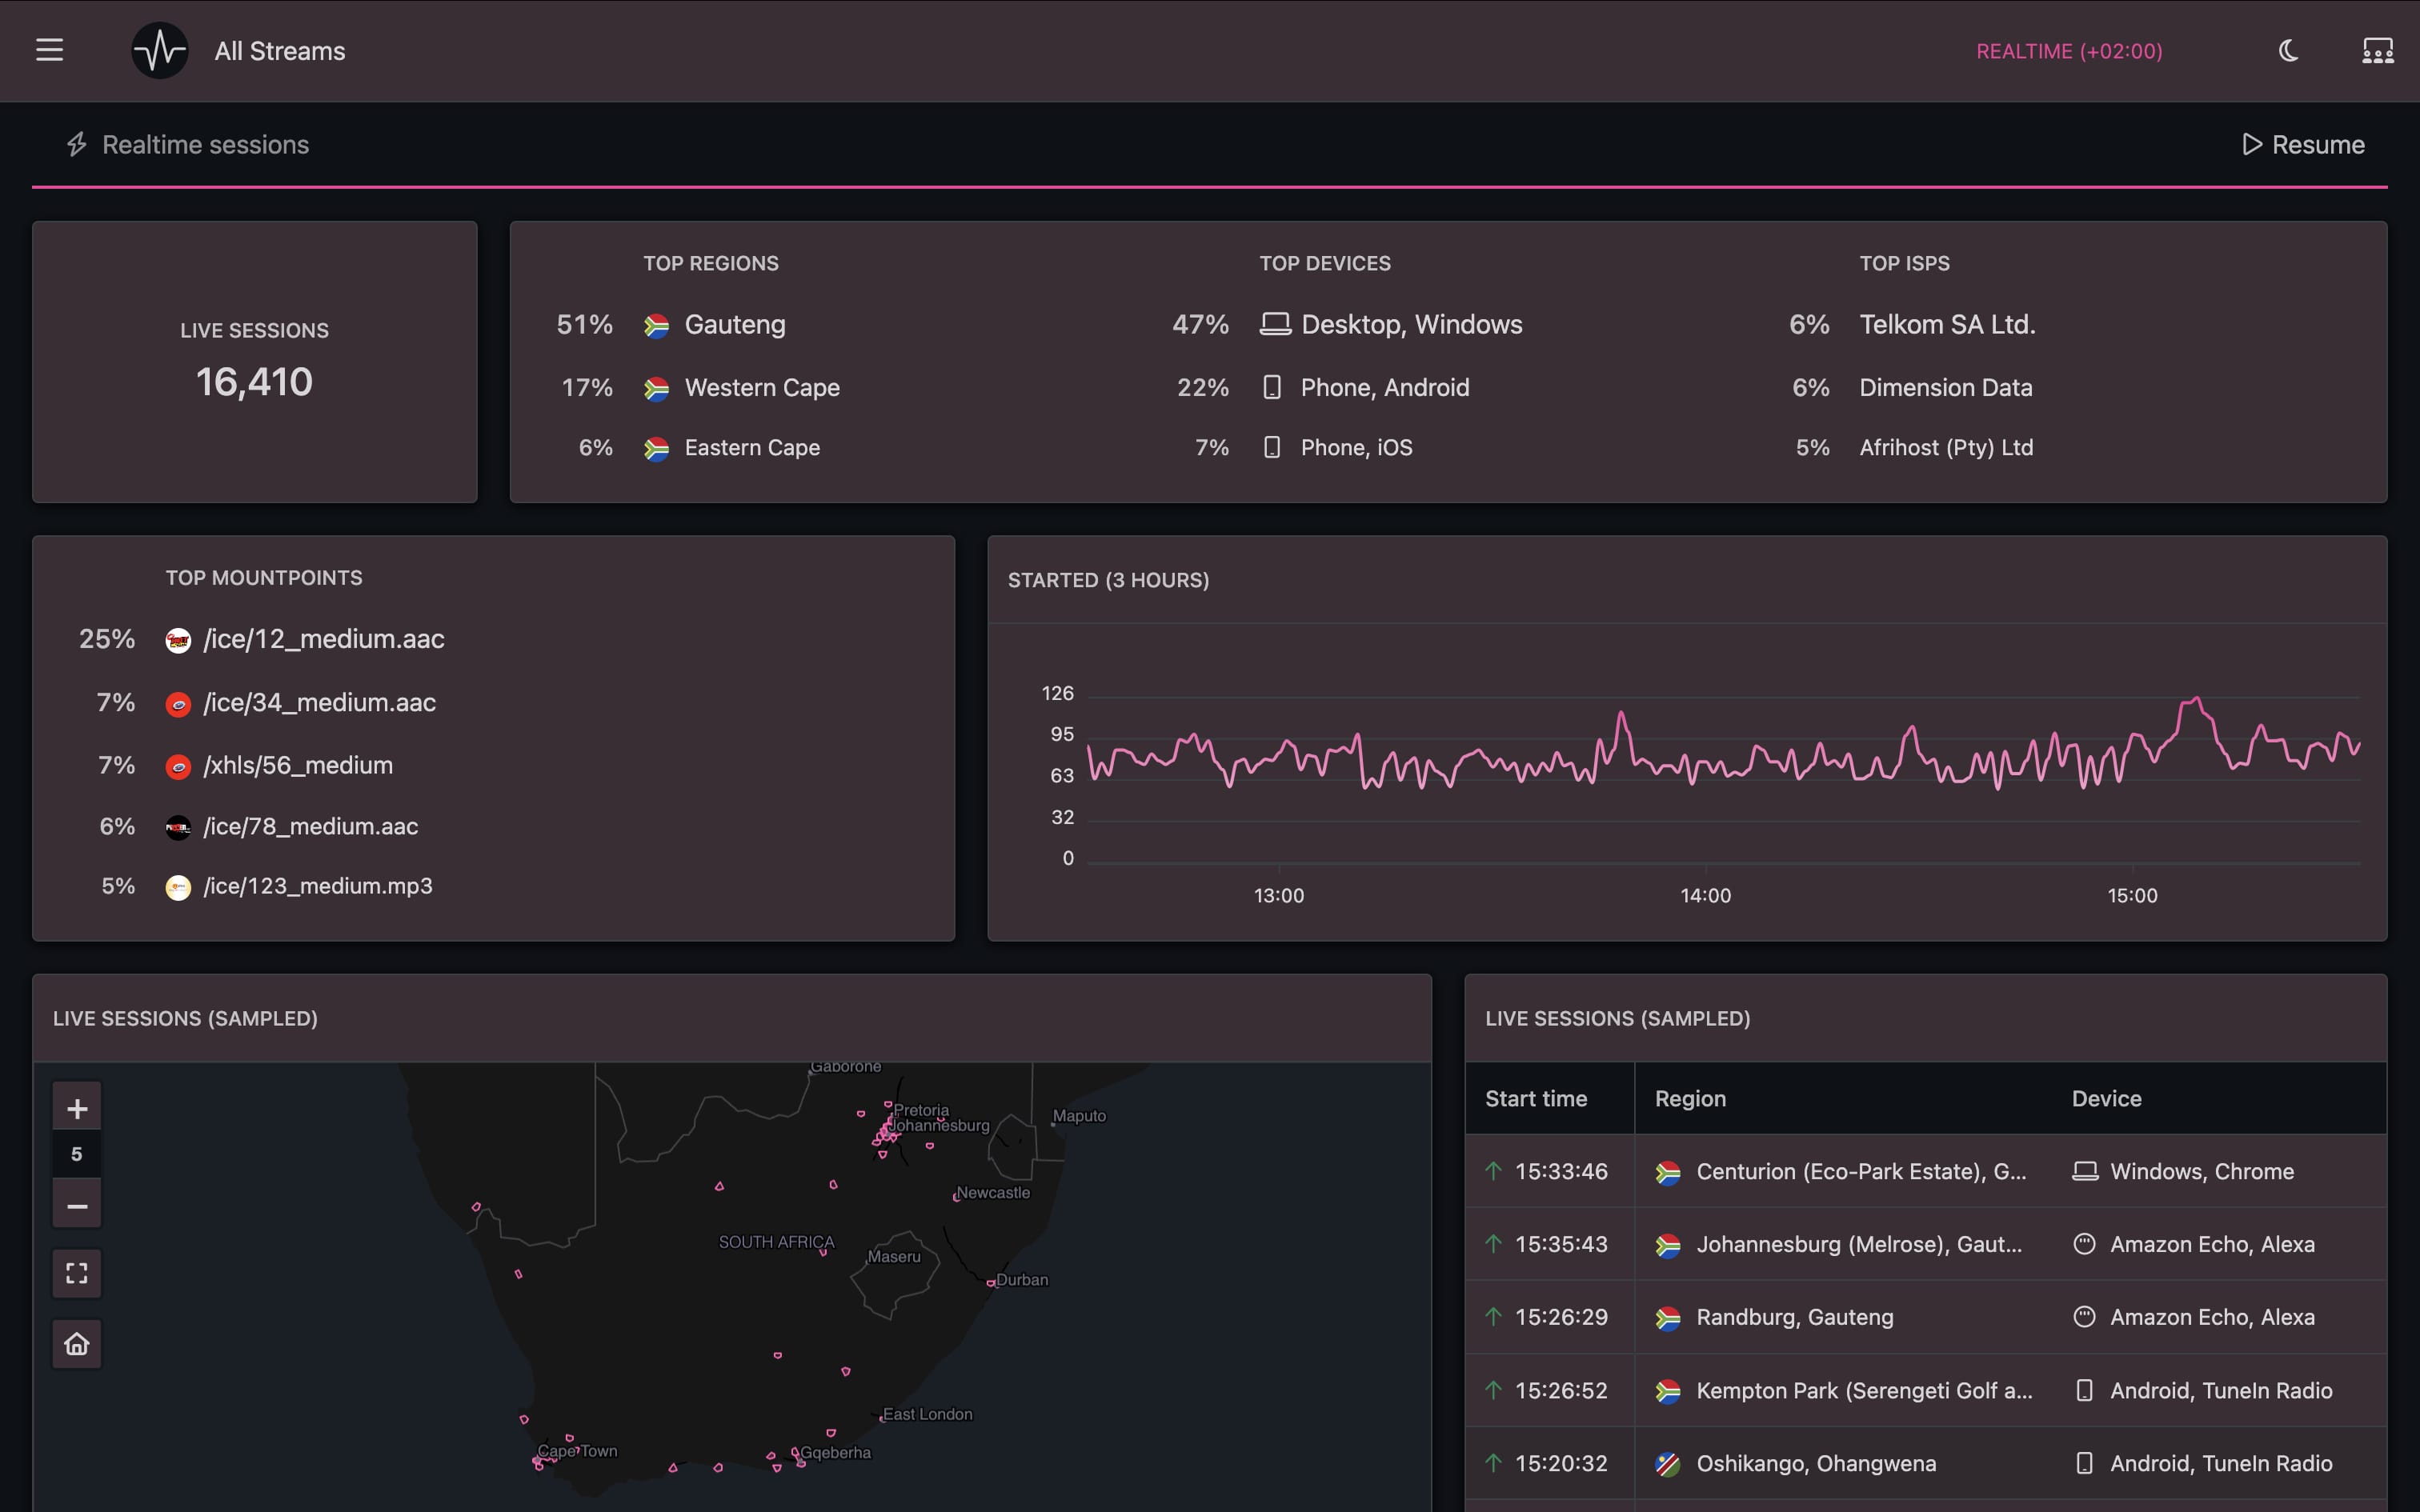
Realtime analytics
Realtime view of stream and podcast activity for display purposes.
- How many sessions are "currently"connected
- Sampled live session activity
- Details of most recently connected sessions
- Breakdown of live sessions by region, application and ISP
- New sessions over the past 3 hours
Presentation mode
Display data on a dashboard or explore analytics during a meeting. Optimises the user interface for display on projectors or public screens.
Dark mode
Reduce eye strain and improve visibility in low-light environments. Use manually or follow the current system mode.
Create stunning PDF's or printed pages.
No more manual importing and graphing of CSV data to report to management or share with advertisers.
Our print features quickly create single or multiple page printouts, ready for distribution to others.
Fully responsive
Perfect experience across all devices.
Analytics that adapts to the user, not the other way round!
Equally comfortable on desktop, laptop, tablet and mobile phones.
Get full analytics on-the-go, browse on your tablet during meetings, explore.

Included with our podcast & streaming packages.
Pricing & signupLearn more
Additional information about our podcast and stream analytics.
